

On this page
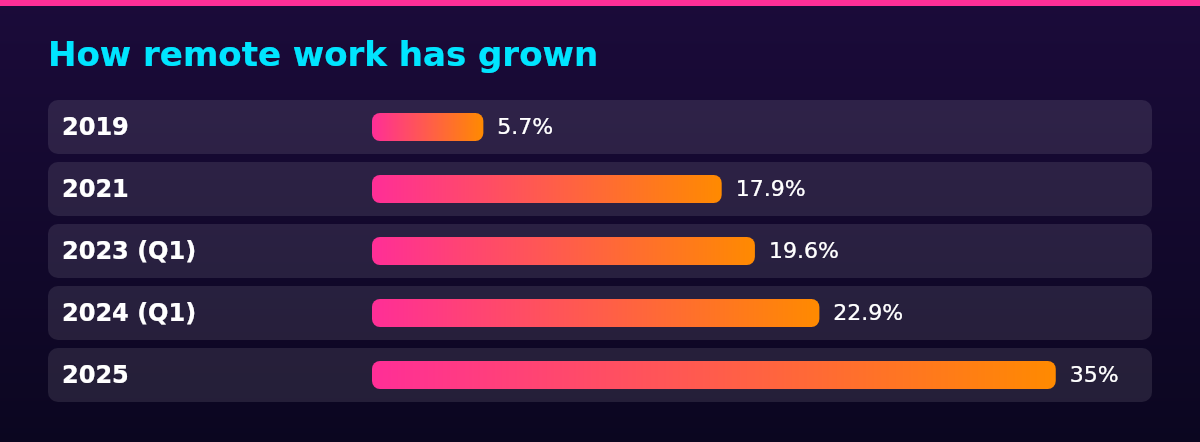
Current remote work stats show that just over a third of employed people in the US now do some or all of their work from home, and hybrid schedules have become more common than fully remote ones. In 2025, 35% of employed people did some or all of their work at home on days they worked, according to the Bureau of Labor Statistics’ American Time Use Survey.
These remote working stats cover how many people work remote, which arrangement they use and how that varies by occupation, the numbers an employer needs before setting a remote or hybrid policy. The figures below come from three federal and survey sources, each with its own year and definition stated next to it, rather than a mixed list where a reader has to guess which number is current.
How remote work has grown
| Year | Share | What it measures | Source |
|---|---|---|---|
| 2019 | 5.7% | Primarily worked from home | Census Bureau |
| 2021 | 17.9% | Primarily worked from home | Census Bureau |
| 2023 (Q1) | 19.6% | Teleworked or worked at home for pay | BLS |
| 2024 (Q1) | 22.9% | Teleworked or worked at home for pay | BLS |
| 2025 | 35% | Did some or all work at home on days worked | BLS |
Compared to before, the share of people who work remotely has grown sharply: the share working primarily from home tripled from 5.7% in 2019 to 17.9% in 2021, according to the US Census Bureau. Those two rows come from the American Community Survey, which counts someone as working from home only when that’s their main arrangement for the whole reference week.
The 2023 and 2024 rows come from a different series, the BLS telework supplement, which asks whether someone did any telework at all during the reference week, even a single day. That’s a broader definition than “primarily worked from home,” so the two series aren’t directly comparable row to row; the right comparison is within a series over time, not across series.
For an employer benchmarking its own policy against these numbers, the distinction matters. A company where a fifth of staff work from home one day a week and a company where a fifth work from home full time would both show up similarly under a broad “any telework” measure, but look very different under a “primarily remote” measure like the Census ACS. Reading the table’s “what it measures” column before comparing a number to an internal figure avoids comparing two different things.
The growth also hasn’t been a straight line. The jump from 5.7% to 17.9% between 2019 and 2021, the move the US Census Bureau reported, was the sharpest move in the table by a wide margin.
The rise from 19.6% to 22.9% between the first quarters of 2023 and 2024, a gain of roughly three percentage points on the BLS telework measure, was comparatively modest next to that earlier jump. The steepest growth phase for remote work, at least as these series capture it, appears to have already happened earlier in this period, with more recent years showing a slower, steadier increase instead. An employer that assumes remote adoption will keep climbing at its early pace risks planning around a growth rate the data no longer supports.
Whether that slower pace holds depends on factors these two surveys don’t capture on their own, including individual employer return-to-office decisions and the broader labor market. For near-term planning, the more recent BLS years are the better baseline to build from than the faster growth the Census data captured earlier, since they reflect where adoption has settled rather than the steepest part of the climb.
Remote, hybrid or on site
| Arrangement | Share of remote-capable employees |
|---|---|
| Hybrid | 52% |
| Exclusively remote | 26% |
| On site | 22% |
Among US employees whose jobs can be done remotely, 52% work a hybrid arrangement, more than work exclusively remote or fully on site, according to Gallup’s hybrid work indicator.
This split is measured only among employees whose jobs can be done remotely, not the whole workforce. Most jobs in the US still can’t be done remotely at all, including most service, production and transportation roles, which the occupation breakdown below shows directly.
For an employer, the practical reading is that fully remote is now the minority arrangement even among jobs built for it. A policy built around hybrid attendance, rather than an all-remote or all-in-office default, matches where most comparable employers with remote-capable roles have already landed.
That split also shapes decisions beyond the policy document itself. A hybrid-heavy workforce still needs desks for most of the week, which calls for a different office footprint than a plan built around the assumption that most people are remote most of the time. An employer sizing a lease or a seating plan off an “everyone remote” assumption, when its own workforce actually splits closer to the 52% hybrid, 26% remote, 22% on-site mix Gallup measured above, is likely to overbuild for remote and underbuild for the office days hybrid staff still need. A seating plan sized for the middle, hybrid, case tends to hold up better as policy shifts than one built around either extreme.
For roles the occupation table below shows can realistically be done remotely, offering a hybrid or remote arrangement is no longer much of a distinguishing perk; at 52%, it’s close to the market default rather than an exception a job posting needs to sell.

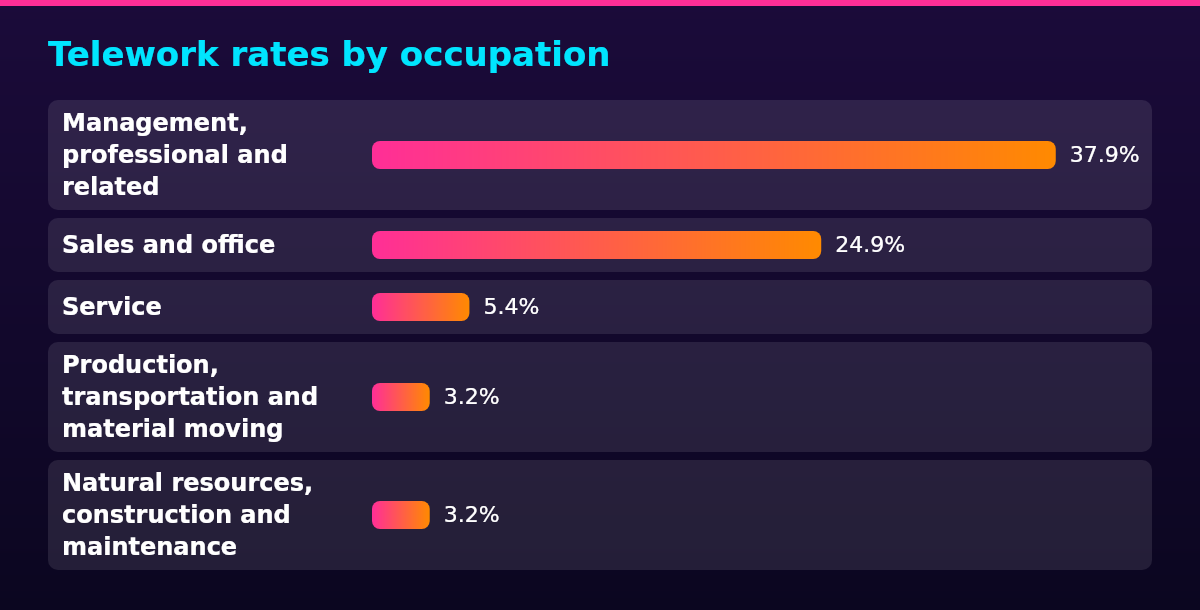
Telework rates by occupation
| Occupation group | Telework rate, Q1 2024 |
|---|---|
| Management, professional and related | 37.9% |
| Sales and office | 24.9% |
| Service | 5.4% |
| Production, transportation and material moving | 3.2% |
| Natural resources, construction and maintenance | 3.2% |
Remote worker stats differ widely by occupation: management, professional and related occupations teleworked at 37.9% in the first quarter of 2024, more than ten times the rate in service occupations, according to the BLS “Telework trends” report.
Within occupations that can telework, the share of teleworkers working from home all of their hours fell from 54.0% in the first quarter of 2023 to 47.9% in the first quarter of 2024, the same BLS telework data shows. More of that telework time is now split between home and the office rather than fully remote, which tracks with the hybrid-heavy split Gallup measured in the arrangement mix above.
The “management, professional and related” group in the table is broad: it’s the BLS’s standard grouping for office-based work generally, covering roles from finance and legal to computer and healthcare-practitioner occupations, not one narrow job title. A company hiring mostly within that group starts from a national baseline where telework is already the norm for more than a third of workers, rather than the exception.
A national occupation rate from the BLS telework data is also an average across employers, not a ceiling for any single company. Sales and office roles telework at 24.9% nationally, but a specific sales or office team whose work doesn’t depend on daily in-person contact can run well above that rate; the gap between a company’s own rate and its occupation’s national average is mostly a record of past policy choices, not a limit set by the job itself.
What the data means for hiring
These stats on remote working point to a practical read for employers: use the occupation table above to sanity-check which roles are realistic candidates for a remote or hybrid policy before writing one. A management or office role with a low telework rate at a given company reflects that company’s own policy as much as the job’s content, so a low national rate alone doesn’t rule out going remote for a specific role. Whether that shift pays off in output is a separate question from whether it’s possible, one that a closer look at remote work productivity answers with its own data. Starting from the occupation data, rather than from assumptions about what “feels” remote-friendly, keeps the policy grounded in how comparable roles are actually staffed today.
Once a role is remote-eligible, the hiring pool is no longer limited by commuting distance. Hiring internationally opens access to talent and salary ranges a local market alone often can’t match, provided the employer also works out how to employ someone legally in another country. That second part is where many employers stall: a remote-eligible role and a legally employable hire are two separate questions, and the growth in remote work shown in the first table has made the first question easier to answer than the second, even as the second question still depends on the specific country and worker classification involved.
An employer with no entity in that country typically needs an employer of record to act as the legal employer on its behalf, handling local payroll and compliance while the new hire reports to the existing team. That route avoids registering a foreign entity just to make one hire, which matters most for the first few international hires before volume might justify setting up locally.
Once the remote or hybrid arrangement is decided, it belongs in a written remote work policy that sets expectations for hours, equipment and communication, rather than being handled case by case as new hires come in. A policy set in writing before the first remote hire also gives existing staff a consistent standard to point to, instead of individually negotiated arrangements that are hard to apply evenly later.
After the team is running, the KPIs used to manage it should reflect output and outcomes rather than hours spent online. The right KPIs for a remote team matter even more given the shift toward hybrid schedules shown above: a hybrid-heavy team needs metrics that hold up whether someone is in the office or working from home that day, not a measure built around being visibly logged in. Metrics tied to visible activity tend to break down exactly where the data above shows most remote-capable employees now sit, splitting their week between home and the office rather than working one way full time.
Reviewing telework rates by role periodically, rather than setting a policy once and leaving it fixed, keeps the policy aligned as job content, collaboration tools and team structure change. A role that couldn’t be done remotely a few years ago may fit the pattern of its wider occupation group today, and the reverse can also happen as a team’s work becomes more collaborative or client-facing. Tying that review to the same cadence as a policy or budget cycle keeps it from being forgotten once the initial remote or hybrid rollout is done.
FAQ
No. The share of employed people working from home at least part of the time has held near 35% through 2025, according to the BLS American Time Use Survey. What has shifted is the mix: more of that time now happens in hybrid arrangements rather than fully remote ones, so the overall share of people doing some work from home hasn’t fallen even as “fully remote, all the time” has become less common.
Among employees whose jobs can be done remotely, 26% work exclusively remote, according to Gallup’s May 2026 hybrid work indicator. Across the whole workforce, including jobs that can’t be done remotely at all, the share working 100% remote is far smaller, since most occupations, as the breakdown above shows, have little or no telework at all.
35% of employed people did some or all of their work from home in 2025, about one in three, according to the BLS American Time Use Survey. That figure counts anyone who worked at home on at least one day they worked; it isn’t limited to employees who are fully remote, so it includes hybrid schedules as well as fully remote ones.
52% of remote-capable employees work a hybrid schedule, more than work exclusively remote or fully on site, according to Gallup’s May 2026 hybrid work indicator. That makes hybrid the single most common arrangement among employees whose jobs allow it, ahead of either fully remote or fully on-site setups on their own.