

On this page
As of March 2026, 22.6% of U.S. workers teleworked or worked at home for pay, according to the Bureau of Labor Statistics. Work from home statistics from the same release show that rate held in a narrow 21.5% to 23.0% band over the trailing 12 months, essentially flat rather than rising or falling sharply. That 22.6% figure spans every employed person, including jobs that cannot be done remotely at all, a broad denominator worth keeping in mind when comparing it with the narrower numbers below.
Among employees whose jobs can be done remotely, Gallup’s hybrid work indicator finds a different split: as of May 2026, 52% work a hybrid schedule, 26% work exclusively remote and 22% work entirely on-site. That three-way breakdown, covered in detail in the table below, describes a smaller and more specific population than the all-worker BLS rate above, a distinction this guide explains fully in the section on why the two kinds of numbers disagree.
Both figures are United States data only; this guide does not generalize either number to other countries, where government telework surveys use different populations, questions and reporting schedules. An employer comparing its own return-to-office or hybrid policy against a benchmark should match the benchmark to its own workforce: the all-worker BLS rate for a broad labor-market comparison, or the Gallup remote-capable split for a workforce made up mostly of desk-based, computer-based roles.
Remote work arrangements by type
| Work arrangement | Share of remote-capable U.S. employees (May 2026) |
|---|---|
| Hybrid | 52% |
| Exclusively remote | 26% |
| On-site | 22% |
This 52%, 26%, 22% split among remote-capable U.S. employees has stayed roughly stable since 2022, according to Gallup, with hybrid the most common arrangement by a wide margin over either exclusively remote or fully on-site work. That stability matters for managing a distributed team, which needs policies built around a predictable mix of in-office and remote days rather than an assumption that most people are either always in or always out.
With hybrid the majority arrangement in Gallup’s data, the scheduling question shifts from whether a team works remotely at all to when its in-office and remote days overlap. A hybrid-majority workforce still needs shared windows for meetings and handoffs regardless of which days each employee is in the office, since the 22% who work entirely on-site and the 26% who work entirely remote still need to coordinate with the hybrid majority on a predictable schedule.

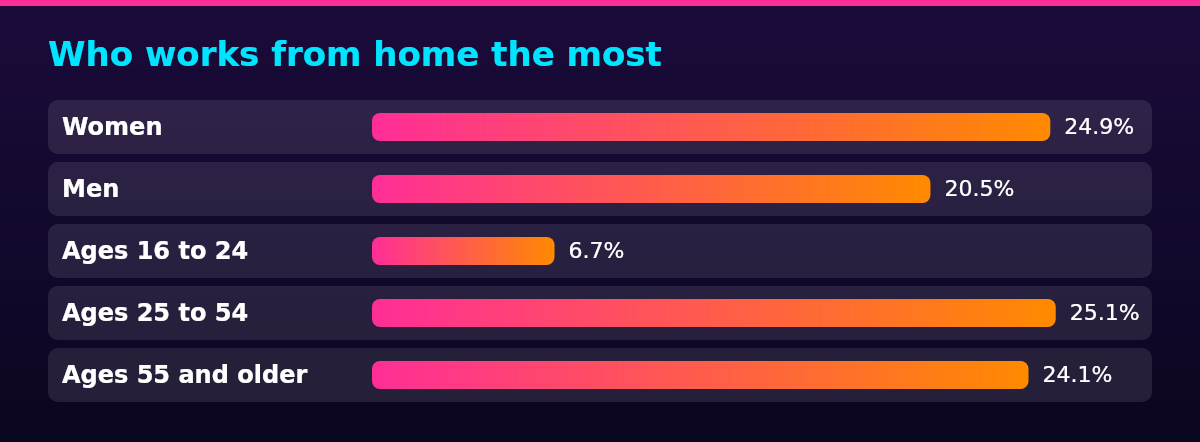
Who works from home the most
| Demographic group | Share who teleworked (BLS, March 2026) |
|---|---|
| Women | 24.9% |
| Men | 20.5% |
| Ages 16 to 24 | 6.7% |
| Ages 25 to 54 | 25.1% |
| Ages 55 and older | 24.1% |
By race, the same BLS release puts Asian workers highest at 31.1%, followed by White workers at 23.2%, Black workers at 16.1%, and Hispanic or Latino workers lowest at 13.1%. The gap between the highest and lowest group, almost 18 percentage points, is wider than the gap between men and women or between any two adjacent age groups. None of these demographic splits should be read as a cause on its own: the BLS release reports the shares, not why they differ, and occupation (which kinds of jobs a given age, gender or racial group is more likely to hold) is the likelier driver behind most of the gap rather than age, gender or race directly affecting whether telework is offered.
Within age groups, the gap concentrates in the youngest workers: those 25 to 54 (25.1%) and those 55 and older (24.1%) teleworked at close to four times the rate of workers 16 to 24 (6.7%), according to the same BLS telework data. That pattern is consistent with younger workers being more likely to hold entry-level roles that still require an on-site presence, while prime-age and older workers are more likely to hold the management, professional and technical roles that telework rates track most closely.
For an employer weighing where remote hiring could expand, these gaps describe current occupation patterns rather than a hard ceiling: the 6.7% rate among workers 16 to 24 reflects which jobs that age group holds today, per the same BLS release, not a fixed limit on how many entry-level roles could be structured as remote in the future.
Why work from home statistics disagree
BLS, Gallup and other trackers publish different telework rates because they measure different populations and different things, not because the underlying trend is actually moving in conflicting directions. The BLS’s 22.6% figure is a share of all employed persons, including jobs that cannot be done remotely at all, measured through its Current Population Survey telework supplement in March 2026.
Gallup’s 52/26/22 split, by contrast, is a share of employees in remote-capable jobs only, a smaller base measured through its own panel in May 2026. Its “26% exclusively remote” describes a narrower group than the BLS’s all-worker rate, so the two figures are not interchangeable even though both are accurate for what they measure.
For an employer, the practical read is to use the all-worker BLS rate to answer how common telework is across the whole labor market, and to use the Gallup remote-capable split to answer how jobs like the ones on a given team are actually arranged. A company staffed entirely with remote-capable roles should expect its own in-office, hybrid and remote mix to track closer to Gallup’s 52%, 26%, 22% figures than to the broader 22.6% BLS average, since that average is pulled down by the large share of U.S. jobs, in retail, manufacturing, healthcare delivery and similar fields, that cannot be done remotely at all.
Confusing the two denominators in a board presentation or a workforce-planning deck is an easy way to overstate or understate how unusual a company’s own remote policy actually is. A finance or people-ops lead comparing headcount plans against “the national remote work rate” should specify which rate: the 22.6% BLS figure if benchmarking against the entire U.S. labor market, or the 52%, 26%, 22% split if benchmarking specifically against other remote-capable employers.
How remote work affects productivity
Work from home productivity statistics from BLS show a measurable, documented link between remote work and productivity growth across private-sector industries. BLS researchers found that a 1 percentage-point increase in an industry’s share of remote workers was associated with a 0.08 percentage-point increase in total factor productivity growth across 61 private-sector industries, over a three-year window ending in 2021, and a similar 0.09 percentage-point association over a four-year window ending in 2022.
Industries saw remote-worker share rise by a weighted average of 11.8 percentage points across that same four-year window, corresponding to about a 1.1 percentage-point increase in industry-level total factor productivity. That cost-side effect is different from output-per-hour measures, including the output-per-hour figures in a deeper look at what these productivity numbers mean day to day, which track worker output directly rather than the cost-side mechanics described here.
The same BLS study found no statistically significant link between the growth in remote work and growth in hourly compensation. The efficiency gain traces to lower growth in nonlabor costs rather than to a measured pay bump for workers, a distinction worth stating precisely rather than rounding into a vague claim that remote work simply makes workers more productive per hour.
For an employer deciding how much weight to put on a productivity argument for or against remote work, the BLS findings support a narrow, specific claim rather than a broad one: industries with a larger remote-work share saw faster total factor productivity growth over the multi-year windows BLS studied, and that growth showed up mainly through slower-growing capital and property costs rather than through employees producing more output per hour worked. A policy decision built on “remote work makes people more productive” overstates what the data shows; one built on “remote work is linked to slower growth in certain overhead costs” matches it.
Real estate savings from remote work
The same BLS study ties more remote work to slower-growing office-building costs, not a one-time dollar savings figure. For every 1 percentage-point increase in an industry’s remote-work share, unit capital-cost growth was about 0.27 percentage points slower and unit office-building-cost growth was about 0.4 percentage points slower, per the BLS’s productivity research.
BLS reports this as a growth-rate effect on costs over the same multi-year window as the productivity findings above, not a total amount saved in dollars, so there is no dollar figure to quote for “how much remote work saves on real estate.” An employer budgeting for a lease renewal or a new office footprint should read this as directional evidence that a larger remote-capable share tends to slow the pace of office-cost growth, not as a number that can be multiplied by headcount.
Because hybrid is the most common arrangement in Gallup’s data rather than fully remote, this cost effect is best read as coming from a mix of full-time and part-time office use, not from most employees leaving the office behind entirely. A real estate plan built around a hybrid-majority workforce typically targets a smaller footprint used more intensely on overlap days, rather than near-zero office space.
That cost effect is one part of the broader case employers make for hiring remote workers, alongside access to talent outside a single commuting radius and the scheduling flexibility that a hybrid-majority workforce, per the arrangements table above, has already made the norm rather than the exception.
FAQ
22.6% of U.S. workers teleworked or worked at home for pay as of March 2026, per the Bureau of Labor Statistics, a rate that has stayed in a 21.5% to 23.0% band over the prior year. Among employees in remote-capable jobs specifically, Gallup finds 26% work exclusively remote and another 52% work a hybrid schedule, so the right answer to this question depends on whether it is being asked about the whole labor market or about remote-capable jobs alone.
No. Gallup’s hybrid work indicator shows the 52% hybrid, 26% exclusively remote, 22% on-site split among remote-capable U.S. employees has stayed roughly stable since 2022, and the BLS’s all-worker telework rate has stayed within a narrow 21.5% to 23.0% band over the past year rather than declining. Neither data source in this guide shows a meaningful downward trend in either the broad telework rate or the exclusively remote share.
Among U.S. employees in jobs that can be done remotely, 26% work exclusively remote as of May 2026, according to Gallup. That figure excludes jobs that cannot be done remotely at all, so it is not a share of the whole labor market; it describes only the subset of U.S. jobs Gallup classifies as remote-capable in the first place.
No. Both data sources in this guide show stability rather than decline: the BLS’s all-worker telework rate has held in a narrow band over the past year, and Gallup’s hybrid-remote-on-site split among remote-capable employees has stayed roughly the same since 2022. Neither the broad adoption number nor the narrower remote-capable breakdown points to a reversal back toward pre-pandemic, fully on-site norms.